Hydrodynamical simulations are formidable tools to study the behaviour of astronomical fluids.
When matched to N-body solvers, they also allow one to model complex phenomena, such as star formation and stellar dynamics.
In the “SImulating the Environment where Globular clusters Emerged” (SIEGE) project, we use cosmological hydrodynamical
simulations to investigate the sites where the first bound stellar clusters originate.
We also run non-cosmological simulations of isolated proto-globular clusters, to model the origin of their multiple stellar populations.
1) Cosmological simulations including the feedback of individual stars
Thanks to the recent, first observational studies of the progenitors of globular clusters (GCs) at high redshift, star clusters have regained significant interest also from a cosmological perspective.
At the present day, resolving the formation of star clusters is one of the most ambitious goals in galaxy formation models.
Most stars form in clustered environments and both young massive clusters (YMCs) and old GCs are ubiquitous
in local galaxies. GCs are typically old systems, with ages above a few Gyr and sizes of a few parsecs, similar to the ones of young
clusters found in the Milky Way (MW) and other local star-forming galaxies. In the light of this evidence, it is
natural to suppose that old GCs represent the surviving subgroup of a larger population of young, dense stellar aggregates that
formed at high redshift.
Studying the origin of GCs in a cosmological framework is a multi-disciplinary task that requires knowledge in separate fields of
astronomy. In fact, the evolution of clusters results from the combination of various processes, including star formation, stellar
evolution, internal, collisional mechanisms such as two-body relaxation and external ones, such as tidal shocks.
Galaxy formation simulations include an accurate description of basic physical processes and are well-suited for studying in detail
the evolution of star clusters.
In the SIEGE project, we model the feedback of single stars at sub-pc resolution in a cosmological simulation (Calura et al. 2022, MNRAS, 516, 5914).
These simulations have very high resolution, between 0.2 and 0.4 parsec, and are capable of reproducing the physical details of the “bubbles” generated even by a few single massive stars, the ones most responsible for stellar feedback.
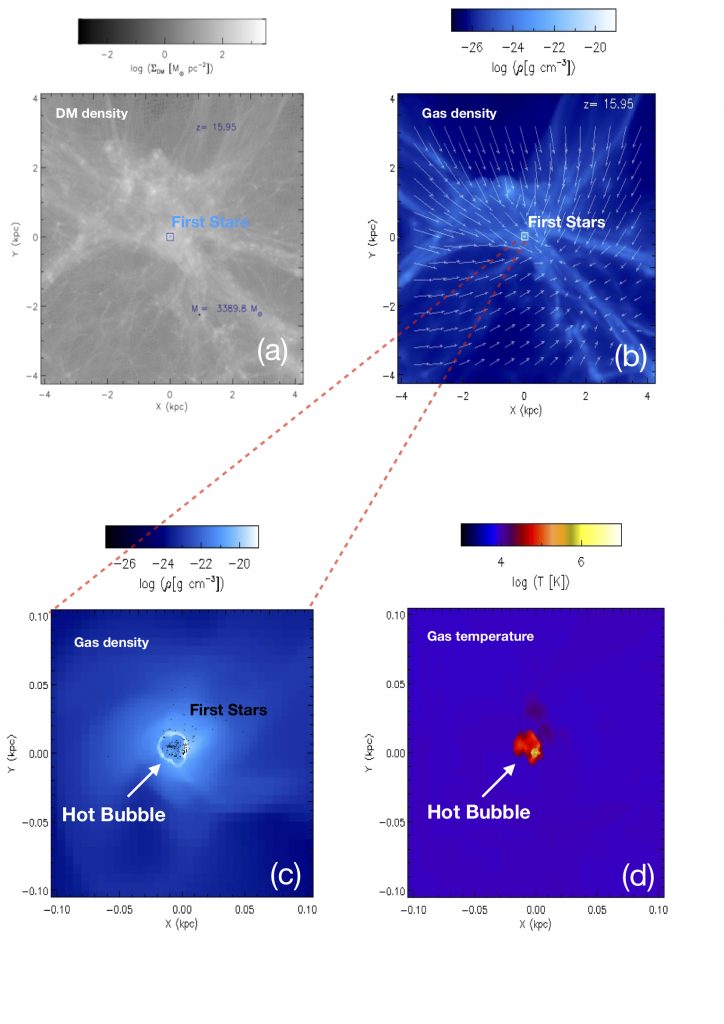
Panel a: dark matter density map centered at the point of the simulation where the first stars form (at redshift 15.95, corresponding to ~250 Myr age of the universe). The first stellar clump is indicated by the blue square. Panel b: Gas density map centered where the first stars form. The first stars are indicated by the white square, while the arrows represent the velocity field of the gas. Panel c: zoom-in of the region corresponding to the white square in panel b, where the first stars are indicated by black symbols. The ‘bubble’ is visible, i.e. the cavity generated by the energy released by the first massive stars, surrounded by a dense ‘shell’ of gas. Panel d: temperature map of the same region shown in panel c, where the high internal temperature of the ‘bubble’ generated by the first massive stars is visible. Credits: F. Calura / Mnras 2022
More to come soon